Deepak Tiwari, Doug Anderson
November 2014
Google Cloud Logging provides facilities for importing, viewing, storing, and retrieving logs from applications running on the Google Cloud Platform.
What is available
Google Cloud Logging includes the following features for App Engine:
- Request logs and application logs for App Engine applications.
- Custom log files for applications using Managed VMs.
- A Logs API (Python, Java, PHP, Go) for accessing logs.
Cloud Logging and Managed VMs apps
Applications using App Engine Managed VMs should write custom log files to
the VM's log directory at /var/log/app_engine/custom_logs. These files
are automatically collected and made available in the Logs Viewer.
Custom log files must have the suffix .log or .log.json. If the suffix is
.log.json, the logs must be in JSON format with one JSON object per line. If
the suffix is .log, log entries are treated as plain text.
Using the Logs Viewer
The Logs Viewer provides a web-based UI to navigate, display, and search your logs. With the Logs Viewer you can view and search logs from all your instances and apply filters to narrow in on a specific event, regardless of where it was generated.
To access the Logs Viewer:
-
Open your project in the Developers Console.
-
Click Monitoring > Logs.
-
Ensure App Engine is selected in the dropdown menu.
-
If your app runs in a Managed VM and writes custom logs, select the desired log name.
Filtering and finding logs
You can choose to view only those logged events that are above a certain severity. Debug events are considered the lowest severity, Critical events are considered the highest. For instance, if you select a minimum severity of 'Warning', all warning, error, and critical log events will be displayed.
When viewing the Request log,
you can combine field filters (for example, status:, protocol:, and so forth) and
regular expressions in the same query, using the filter text box in the
Logs Viewer. In addition, you can add and
remove filters to help drill down and then zoom out again until you find what
you’re looking for. Simply modify the query and press Enter to refresh the logs.
When you click the search bar, the Logs Viewer shows possible completions for
filter fields as you type. For example, typing u would produce the following
possible completions:

Filters of the same type are ORed together, while different
filter types are ANDed together. So for example,
status:400 status:500 regex:quota would produce all requests that returned
HTTP status of either 400 OR 500, AND have the word quota in the log.
Field filters aren't yet supported for Managed VM custom logs, but you can use regular expressions to search custom logs.
Search or scroll through all of your logs
When you scroll through your logs in the new Logs Viewer, results are fetched until the console window is full. To retrieve additional logs that match the query, scroll down for newer results or up for older ones.
This provides you with a continuous view of your events to enable you to move forward and backward in time without requiring you to click Next or refresh the console. While results are being fetched you will see a Loading… indicator at the top or bottom of the viewer.
You can also click the refresh icon to load the latest logs, or click the play icon to live stream the logs for all of your logs from all of your instances.
Downloading logs from App Engine
For download information, see the log downloading instructions for Python, Java, or Go.
How to read the log information
The log fields are documented in the Logs API pages for Python, Java, Go, and PHP.
Using Logging in your app
This part of the article describes how to add logging to your App Engine Python SDK app or your Java SDK app. Click the tab for details in the SDK you are interested in.
Python SDK
You may find it useful to read the documentation for the standard Python logging module at Python.org.
The Python logging module allows a developer to log 5 levels of severity:
- Debug
- Info
- Warning
- Error
- Critical
The following example shows how to use some of these levels to log events in a simple Guestbook application:
import logging
import os
import datetime
import wsgiref.handlers

from google.appengine.api import users
from google.appengine.ext import db
from google.appengine.ext import webapp
from google.appengine.ext.webapp import template

class Post(db.Model):
    author = db.StringProperty()
    content = db.StringProperty()
    date = db.DateTimeProperty()https://docs.google.com/a/google.com/spreadsheet/ccc?hl=en_US&hl=en_US&key=tw1ZFtv5Lbbr5G7i5GnS47A#gid=72

class MainPage(webapp.RequestHandler):

  def get(self):
      # Retrieve existing posts from the datastore when getting the Main Page
      try:
          post_query = db.GqlQuery('SELECT * FROM Post ORDER BY date DESC')
          posts = [post for post in post_query]
      except:
          logging.error('There was an error retrieving posts from the datastore')

      template_values = {
          'posts': posts,
      }
      path = os.path.join(os.path.dirname(__file__), 'index.html')
      self.response.out.write(template.render(path, template_values))

class Guestbook(webapp.RequestHandler):
    # The user has posted a comment to the guest book
    def post(self):
        logging.debug('Start guestbook signing request')

        post = Post()

        if users.get_current_user():
            logging.info('Signed by user %s', users.get_current_user().nickname())
            post.author = users.get_current_user().user_id()
        else:
            logging.info('Signed by anonymous user')

        post.content = self.request.get('content')
        post.date = datetime.datetime.now()

        try:
            post.put()
        except:
            logging.error('There was an error saving comment %s', self.request.get('content'))

        logging.debug('Finish guestbook signing')
        self.redirect('/')

application = webapp.WSGIApplication([('/', MainPage),
                                      ('/sign', Guestbook)],
                                     debug=True)

def main():
    # Set the logging level in the main function
    # See the section on <a href="/appengine/docs/python/#Python_App_caching">Requests and App Caching</a> for information on how
    # App Engine reuses your request handlers when you specify a main function
    logging.getLogger().setLevel(logging.DEBUG)
    webapp.util.run_wsgi_app(application)

if __name__ == '__main__':
    main()
In our example, we call debug() to provide information
about the requests coming into our handler. We call info()
to provide information about the users of our application, and we call
error() to tell us where our application is experiencing errors.
Later, we can use this information to filter out only the actions we are interested in. This will help us troubleshoot our code, improve the user experience, or add additional features to our application.
Java SDK
The App Engine Java SDK allows a developer to log 5 levels of severity:
- DEBUG
- INFO
- WARNING
- ERROR
- CRITICAL
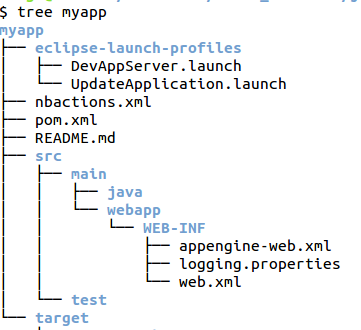
In order to add logging to your Java app, you'll first need to add the appropriate
system properties to your project's appengine-web.xml file, and you may
also need to modify the logging.properties file to set the desired log level.
Both of these files are created for you when you create a new App Engine Java
project using Maven. You can find these
files at the following locations:
Edit the appengine-web.xml file to add the following inside the
<appengine-web-app> tags:
    <system-properties>
        <property name="java.util.logging.config.file" value="WEB-INF/logging.properties"/>
    </system-properties>
Notice that the default log level in logging.properties is WARNING, which
suppresses INFO messages from the output. To change the log level for all
classes in your app, edit the logging.properties file to change the level.
For example change:
.level = WARNING
to:
.level = INFO
Inside your application code, log messages as desired using the java.util.logging.Logger API. When your app runs, App Engine records the messages and makes them available for browsing in the Admin Console, and available for downloading using the AppCfg tool. The Admin Console lets you browse messages by log level.